One of the daunting things about working with climate change is just finding a way to get into the data. Climate Wizard is an easy, map-based interface that lets you look at precipitation and temperature changes using the IPCC scenarios. You can look at means or best and worst-case scenarios of the climate runs, anomalies, and at any area on the planet. I have a feeling we might be using this one in class.
Also, EOS-Webster is the mother lode for earth science information. Their climate change resources and visualizations are particularly good.
Tuesday, January 31, 2012

Climate Visualizations
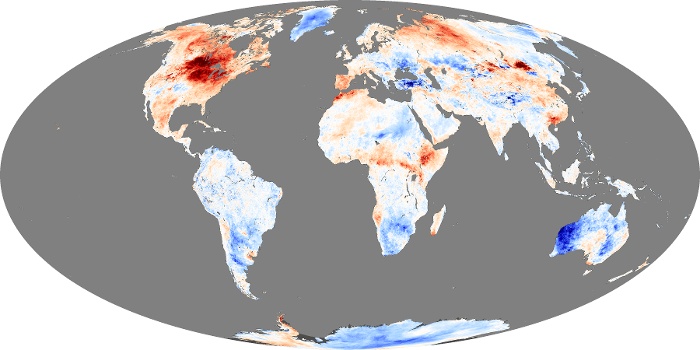 There are a lot of great resources on the web that can help you understand climate. Going straight to the sources of data, such as the Tropical Rainfall Monitoring Mission (TRMM) site is a great way to find data. [Note: loop this animation and groove deeply on the annual cycle in precipitation--where is the ITCZ? The monsoons? Why is it raining over the Gulf Stream? Where isn't it raining?]
NASA has focused a lot of effort on explaining the earth system, and they have dynamite overviews of things like radiation balance, aerosols, biogeochemical cycles, etc., at their website:
http://earthobservatory.nasa.gov/Features/ . (My lab had a hand in the Seeing the Forest for the Trees feature on forest carbon through our collaboration with Sassan Saatchi at JPL/CalTech.). Or, go straight to the good stuff by looking at the figures generated from remotely sensed data. These are excellent visualizations of most of the climate parameters that we have talked about in class.You can get lost in these figures, and there are some great animations as well.
Finally, catching up on ENSO from today's class, here is the NOAA information page on ENSO
and this excellent visualization of SST anomalies and precipitation changes;
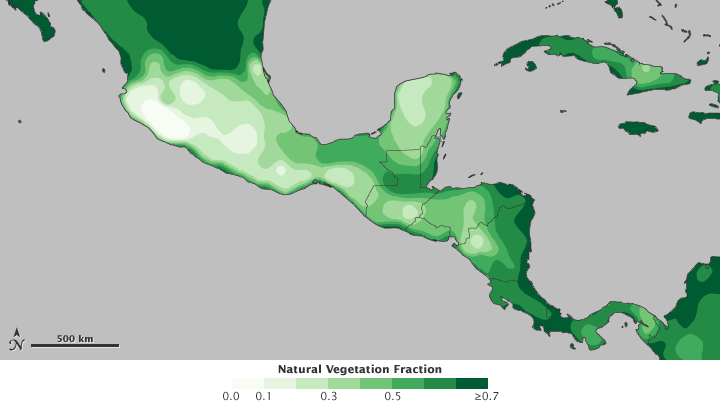
Deforestation, Maya, and Climate Feedbacks
Also, continuing on the forcings and feedback discussion that came up in class today about greenhouse gasses, here is a nice overview site of the roles of non-condensing greenhouse gasses, particularly CO2, in climate forcing, and water vapor and clouds as feedbacks. Again, picking up on the material covered in class today, it shows how you can use climate models to perform virtual experiments on the earth system. If you want to try this yourself, see the edGCM in the previous post.
edGCM: Climate Modeling for the rest of us

Hey guys, here is a link to edGCM, a climate model that runs on your laptop. This might be a fun way to get predictions for species migration modeling if you wanted to incorporate your own scenarios, or look at species migrations during some climatic events in the past. For example, what were predicted range shifts and extinction probabilities under some of the rapid climate change events of the Pleistocene (DO events, etc.)? How does that compare with those predicted for this century?
Friday, April 3, 2009
State of the Birds

In class we looked at how we might predict how different species of birds would fare in the future, but how are they doing now? The Audubon Society has produced its State of the Birds report, and you'll find it interesting reading. Forest birds in the east are taking it on the chin.
Friday, March 27, 2009
R resources

I've sent out some R resources before, but I thought I would repost a couple good ones here. The first is the Quick-R Home Page. This can get you answers to some tough problems fast (e.g., picking among some of the advanced graphical parameters--what does pch=19 look like, anyway?). Another resource that can lead you through the basics, in addition to the excellent R introduction at CRAN, can be found with the SimpleR package.
Here are a couple of more resources that you might find useful. Emmanuel Paradis' book R for Beginners is a nice introduction with code, and Dave Roberts' R for Ecologists pdf is a good resource as well. His R Labs for Vegetation Ecologists are also great. And, if you're interested in continuing on with quantitative analysis in ecology, Ben Bolker's Ecological Models and Data in R is great, and for the hardened core of modelers, Jim Clark's Models for Ecological Data is the go-to book.
Tuesday, March 24, 2009
RFID tags

Reading about tagging sea turtles you might get discouraged about how we mark animals long-term. One thing that we can use is RFID chips. Here is a company that sells them too. Maybe a few turtles need these...
Subscribe to:
Posts (Atom)